Picture of the month: Urban Street Networks for people From the SpACE Lab at ISU – Institute for Sustainable Urbanism
What role does a street play in the overall network? And how do the individual segments of the urban street network relate to each other? This is what the SpACE Lab at ISU – Institute for Sustainable Urbanism at Technische Universität Braunschweig is working on. The “Spatial Analytics and Crossdisciplinarity Experimentation Lab” develops data-driven methods and solutions for human centric sustainable mobility. In the work shown here, the interdisciplinary team focuses on developing a network-based user-centric categorisation of street segments. This can be used, for example, to make statements about the quality of the network for different street users. Our picture of the month May visualises this categorisation to get a better understanding of the Urban Street Network.
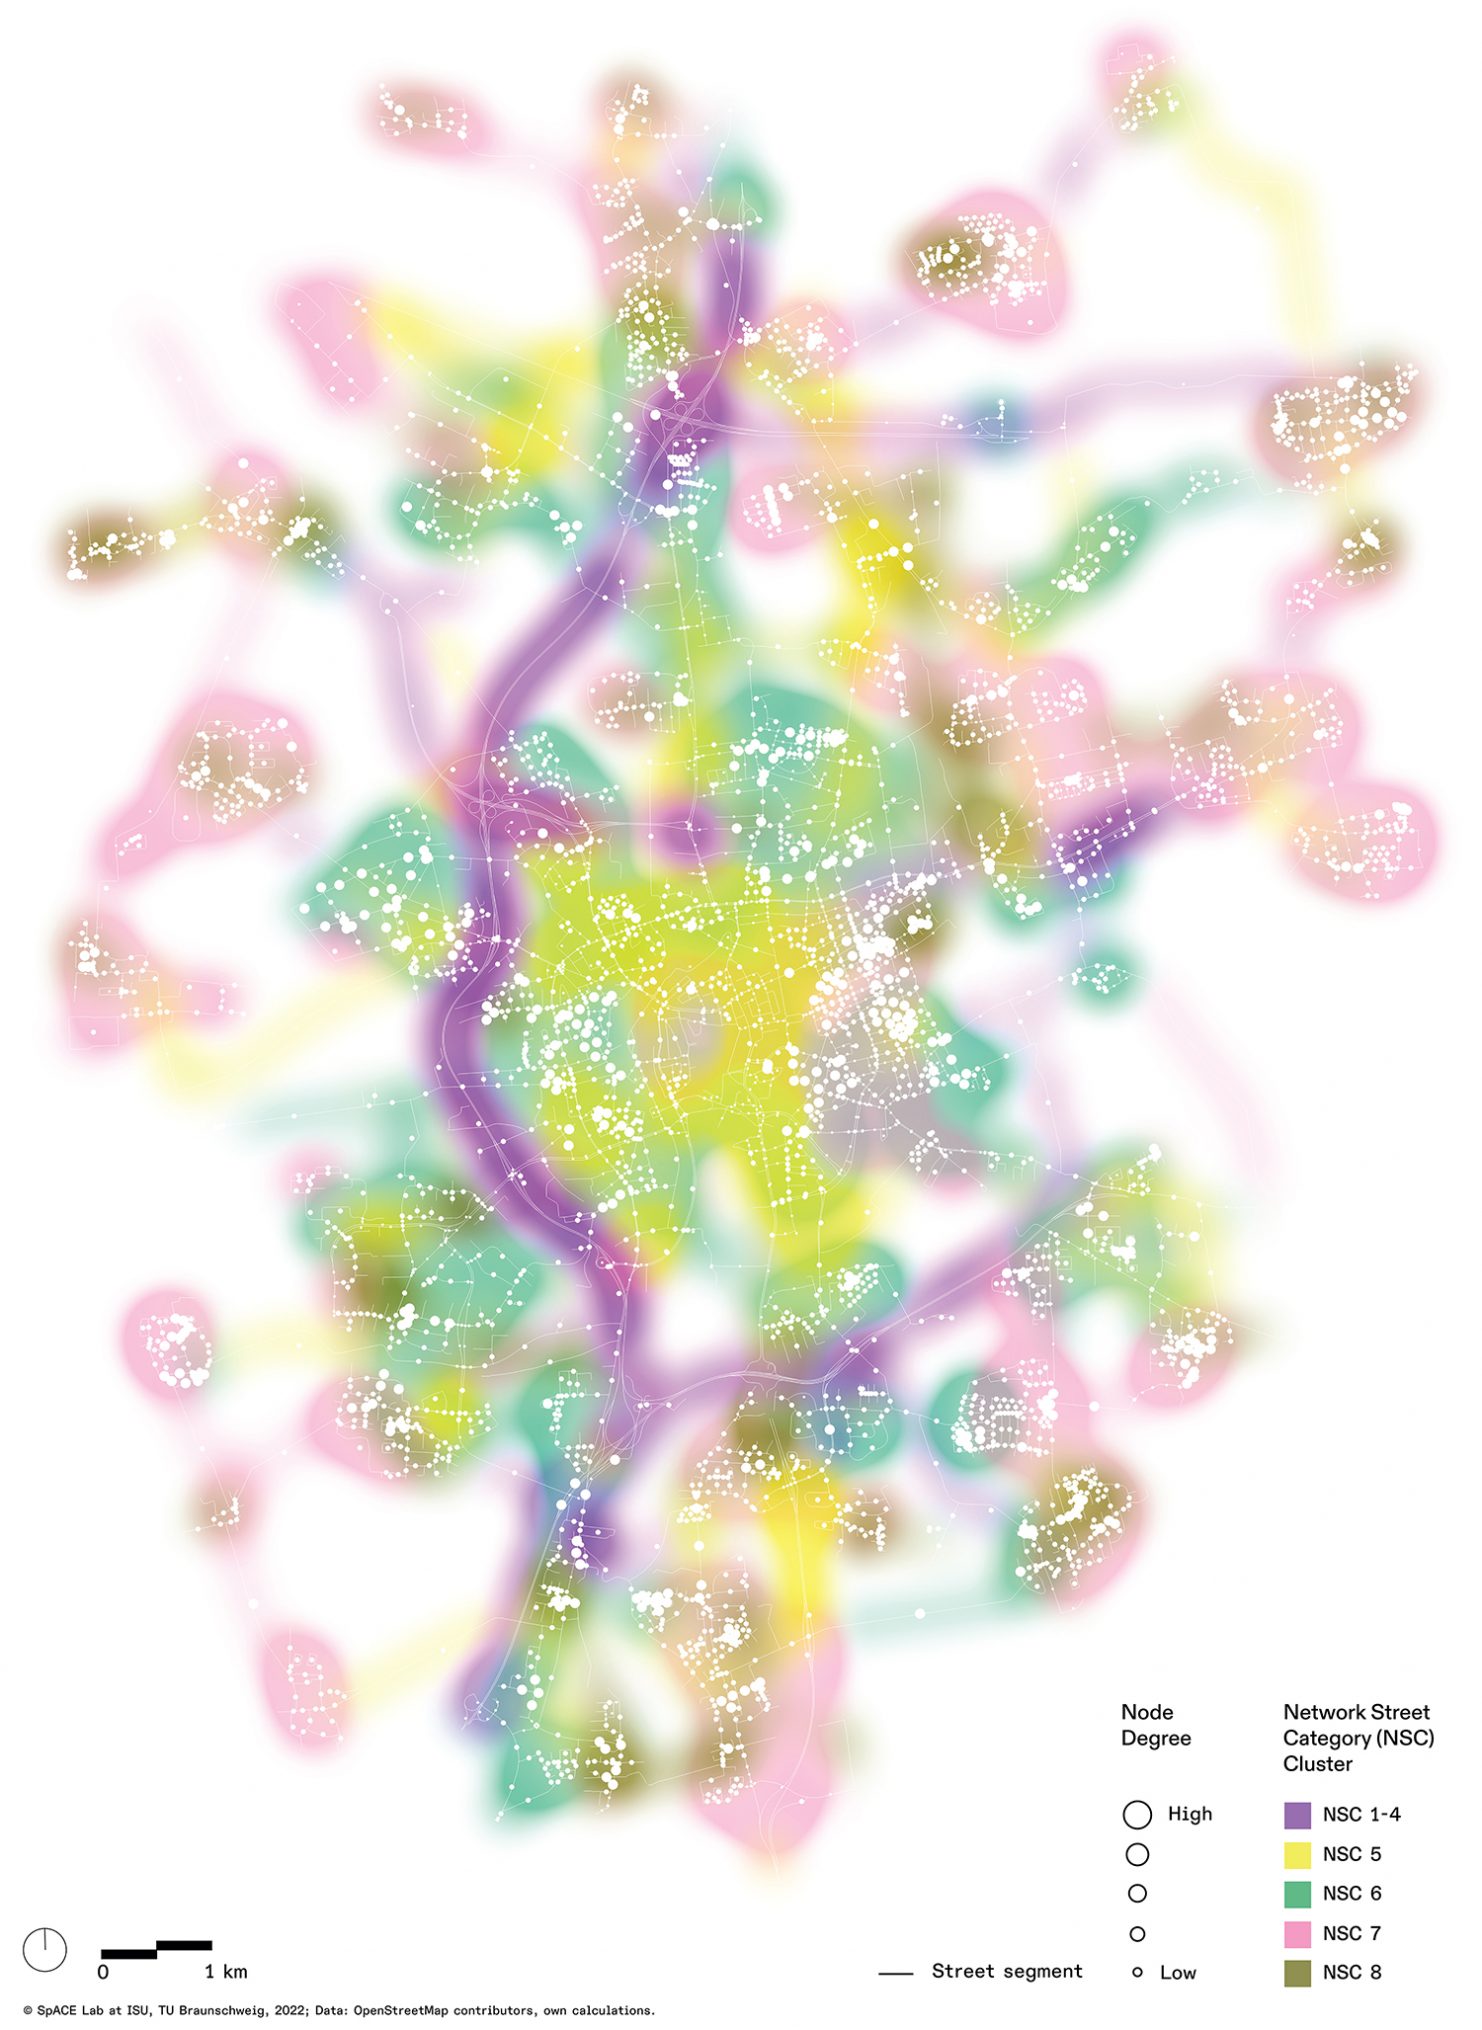
An unusual view of Braunschweig: The SpACE Lab visualised the user-centric categorisation of street segments. Picture credits: SpACE Lab/TU Braunschweig; Data: OpenStreetMap contributors; own calculations; Visualization: Majd Murad and SpACE Lab Team, 2022.
An Urban Street Network (USN) stems from connections created between settlement units depicting social, economic, and natural factors. By employing a machine learning approach to cluster street segments based on their centralities, which indicate their intermediary, accessibility, connectivity and the importance of the neighboring segment.
The users’ perspective
The visualisation gives a small insight into the current research of the SpACE Lab at ISU on human centric mobility. The perspective of the users determines the categorisation and clustering of street segments with similar characteristics rather than functional or administrative attributes.
The researchers use various libraries of the programming language Python, machine learning techniques and multidimensional spatial data analysis to explore multiple features, such as accessibility and connectivity, that characterise the street segments in Braunschweig.
Categorisation of street segments
The map visualises the identified clusters as well as the feature “connectivity”: Each end of a segment (node) is represented by a dot and normally represents a crossing point. The size of the dots refers to the number of other segments to which each segment end is connected. For example, a node connecting four segments (an intersection of two roads) would be larger than a node of a cul-de-sac. Larger dots therefore mean better connectivity. The colour gradients, on the other hand, show the spatial distribution of the identified cluster segments that belong to the same Network Street Category (NSC) developed by the interdisciplinary team.
This analysis can be used to identify strengths and weaknesses of specific segments in the street network. It is then possible to propose appropriate changes to the transport network, to monitor and analyse the traffic flow of the different modes of transport, especially pedestrians and cyclists, and to assess the resilience and reliability of the network to disruptions or congestion, such as traffic jams.
Better transport network for pedestrians and cyclists
For instance: In a residential street, the noise level should normally be lower due to the speed limit. However, if the road is busy and well connected due to its importance in the urban street network, a noise detector can be placed in the identified road segments to check if the noise level is higher than what is expected in residential streets. If a section with high topological importance – meaning that it mathematically represents the best connection from A to B, for example, or is linked to numerous other segments – does not yet have a bike lane, it could be a potential candidate for the construction of a bike lane. From the perspective of encouraging the more sustainable and active transportation modes, such as walking or cycling, increasing the functionality of a street segment may also contribute to a higher connectivity of the network for pedestrians or cyclists.
“For investment decisions on the location of new infrastructures or businesses, collecting data is often resource-consuming or even impossible,” agree Dr Hsiao Hui Chen, Olaf Mumm and Prof Dr Vanessa Carlow. “Analysis using the proposed method offers cost- and time-efficient recommendation and direction as the starting point in a decision-making process before further evaluation in the next stage.”